A graph or chart diagram represents your set of data.If you want to show your company report then you must use chart control. There are different types of chart show different types of data such as
 |
| Pie Chart |
Using the pie-chart you can classify your data in graphical format. According to above diagram your movie are divided in different sections such as Action take 18% of whole movie as well as 11% take Horror.
Example of How to bind Chart Control using SqlDataSource
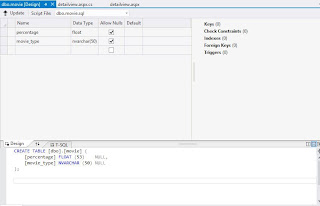
Step-1: Create Database Table in visual studio.
.
Step-2: Bind connection with Database using SqlDataSource
<%@ Register assembly="System.Web.DataVisualization, Version=4.0.0.0, Culture=neutral, PublicKeyToken=31bf3856ad364e35" namespace="System.Web.UI.DataVisualization.Charting" tagprefix="asp" %>
<!DOCTYPE html>
<html xmlns="http://www.w3.org/1999/xhtml">
<head runat="server">
<title></title>
</head>
<body>
<form id="form1" runat="server">
<div>
<asp:Chart ID="Chart1" runat="server" DataSourceID="SqlDataSource1" OnLoad="Chart1_Load">
<series>
<asp:Series ChartType="Pie" Name="Series1" XValueMember="movie_type" YValueMembers="percentage">
</asp:Series>
</series>
<chartareas>
<asp:ChartArea Name="ChartArea1">
<Area3DStyle Enable3D="True" />
</asp:ChartArea>
</chartareas>
</asp:Chart>
<asp:SqlDataSource ID="SqlDataSource1" runat="server" ConnectionString="<%$ ConnectionStrings:ConnectionString %>" SelectCommand="SELECT * FROM [movie]"></asp:SqlDataSource>
</div>
</form>
</body>
</html>
Output<!DOCTYPE html>
<html xmlns="http://www.w3.org/1999/xhtml">
<head runat="server">
<title></title>
</head>
<body>
<form id="form1" runat="server">
<div>
<asp:Chart ID="Chart1" runat="server" DataSourceID="SqlDataSource1" OnLoad="Chart1_Load">
<series>
<asp:Series ChartType="Pie" Name="Series1" XValueMember="movie_type" YValueMembers="percentage">
</asp:Series>
</series>
<chartareas>
<asp:ChartArea Name="ChartArea1">
<Area3DStyle Enable3D="True" />
</asp:ChartArea>
</chartareas>
</asp:Chart>
<asp:SqlDataSource ID="SqlDataSource1" runat="server" ConnectionString="<%$ ConnectionStrings:ConnectionString %>" SelectCommand="SELECT * FROM [movie]"></asp:SqlDataSource>
</div>
</form>
</body>
</html>


Tidak ada komentar:
Posting Komentar